Power line noise has a distinctive 120 Hz (in the US, 100 Hz in some countries) buzz to it. However, receivers often have a 300 Hz high pass filter in the audio (or in the sideband filter), so there is no 120 Hz component present. We can think of the noise source (whether due to arcing or a noisy switch mode power supply that generates noise on the AC line peaks) as a noise generator (such as an arc transmitter) that is keyed 120 times a second. On the receiver output, this appears as noise bursts 120 times per second.
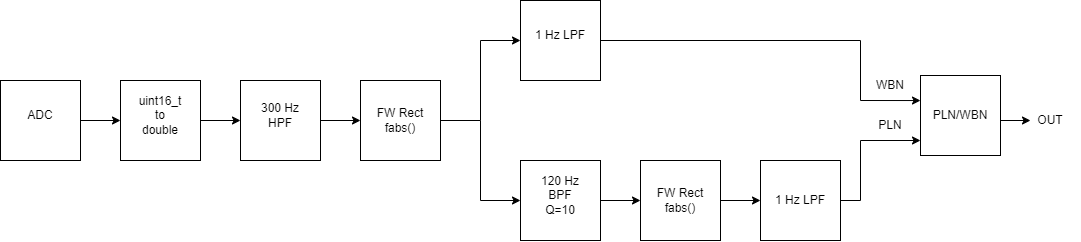
The block diagram at the right illustrates the DSP code used to quantify power line noise measurement. The ADC samples the incoming receiver audio as 12 bit samples at 8 kHz. The hardware driving the ADC input centers the audio between ground and +3.3 V. The uint16_t to double centers the ADC output (converts it to signed 16 bit then subtracts the 1/2 full scale of the ADC). The resulting signed integer is scaled and converted to a double such that the ADC input is converted to a double in the range -1.0 to +1.0. This double is used for power line noise detection as well as RTTY demodulation (see DSP TU2).
The double precision samples are passed through a 300 Hz high pass filter to remove any DC bias. The resulting audio samples are passed through a full wave rectifier (fabs() function). This is envelope detection or AM detection of the wide band noise from the receiver. The FW rectifier drives a 1 Hz low pass filter whose output is the average (not RMS) of the wide band noise. The output of the full wave rectifier also drives a 120 Hz bandpass filter (100 Hz for 50 Hz countries) with a Q of 10. The output of this filter is the 120 Hz component of the "demodulated" noise. The bandpass filter output is run through another full wave rectifier and 1 Hz low pass filter to determine the relative amplitude of the power line noise (120 Hz component in the "demodulated" noise). Finally, the ratio of the Power Line Noise to the Wide Band Noise is determined and output to the user.
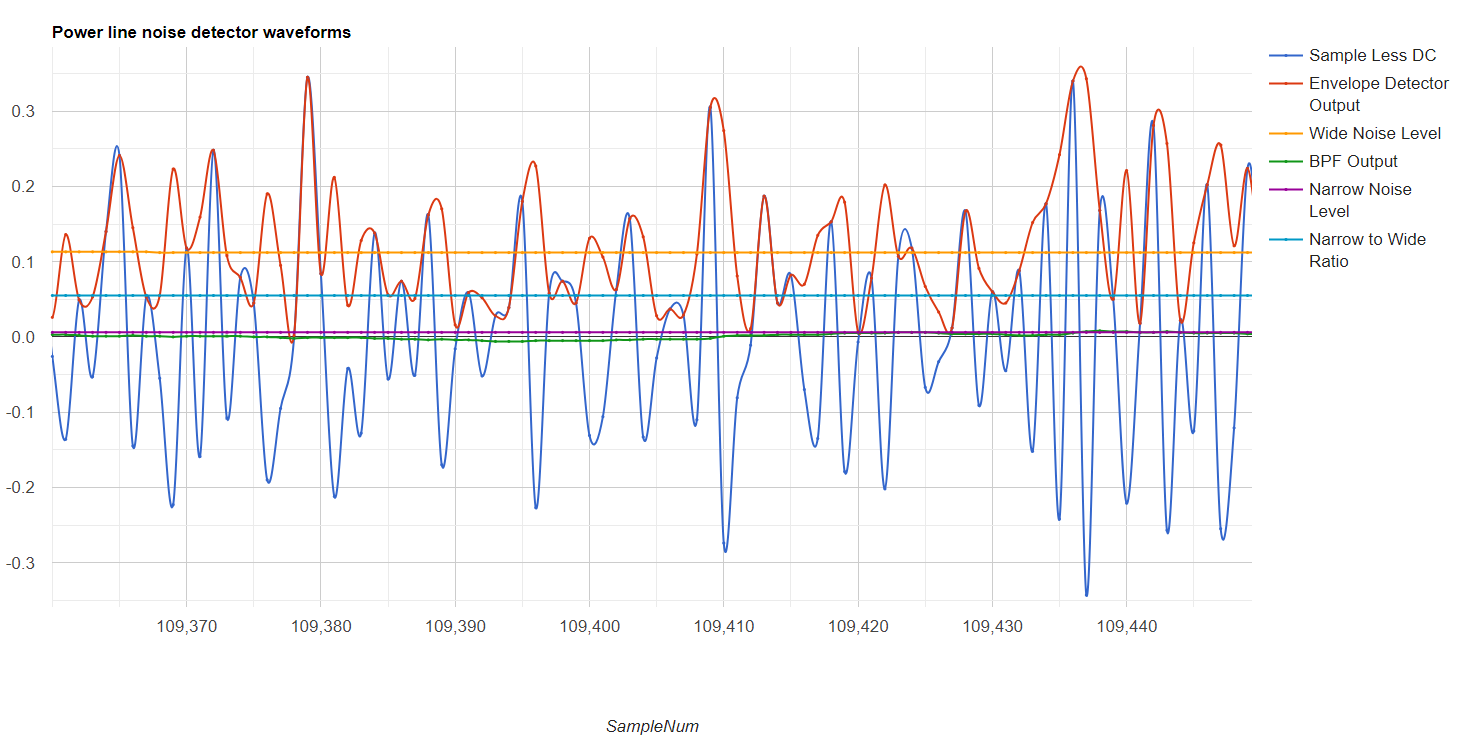
To test the system, the code was modified to run the USB UART at 2 Mbps. The data was captured with Tera Term. Initially, the logging function of Tera Term was used. However, there were large gaps in the saved data. Tera Term apparenly stops receiving data during a write to disk, or saves data in a small FIFO to later write to disk. In any case, large gaps appeared in the data. However, Tera Term can be configured to have a large screen buffer. The comma separated value data sent by the code through the USB UART went to the screen buffer. Then a copy and paste put it in a file. Headers identifying the fields were added. The resulting data is here and graphed here. The image at the right shows a zoomed in section of the data.
This data is from an SSB receiver on 20 meters with no audible power line noise. The blue trace is the output of the 300 Hz high pass filter which removes DC from the input. The red trace is the absolute value of the blue trace (the same as full wave rectification). The full wave rectifier signal is passed to the 1 Hz low pass filter to yield the average level of the wide band noise. This is the orange trace and has a typical value of 0.112. The full wave rectifier output is also passed to the 120 Hz band pass filter. The output of this band pass filter is the green trace, which is very close to zero (has a peak value of about .008. The bandpass filter is passed through another full wave rectifier and 1 Hz low pass filter to yield the Narrow Noise Level. A typical value here is about .006. Finally, the ratio of narrow noise level to wide noise level is computed and output as a relative power line noise level, here about .052.
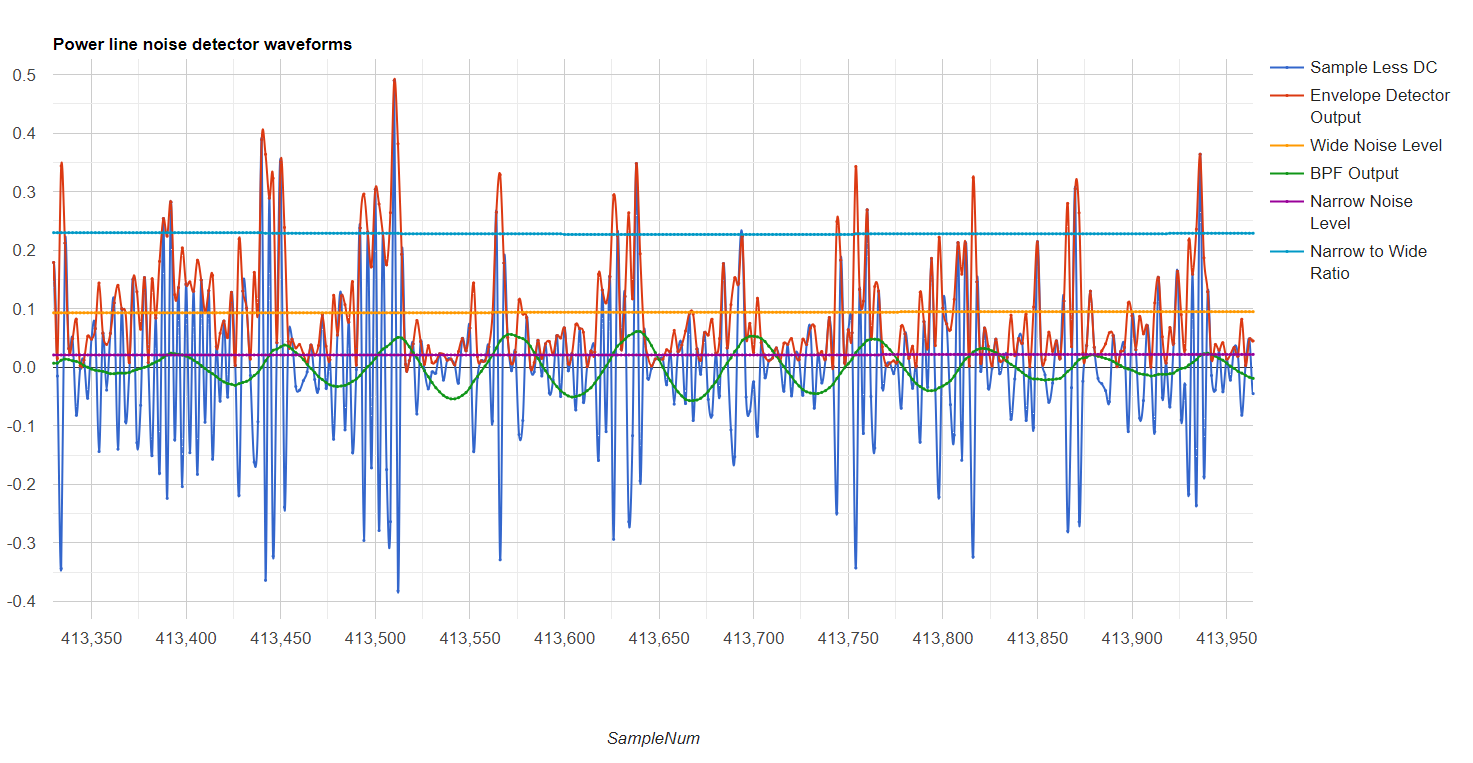
For comparison, a recording of noise with power line noise was fed into the system (recording). The captured data is here, and a graph is here. A zoomed in image of the graph is to the right. Note that the terminal could not keep up with the data on every sample, so every other sample is sent.
The graph colors represent the same data as described above. Note that the green trace (output of the 120 Hz BPF) is much larger, now peaking at about .056 compared to .008. The Narrow to Wide Ratio is now about 0.227, indicating a fair amount of power line noise, compared to .052 when there is no audible power line nose.
Using the Data
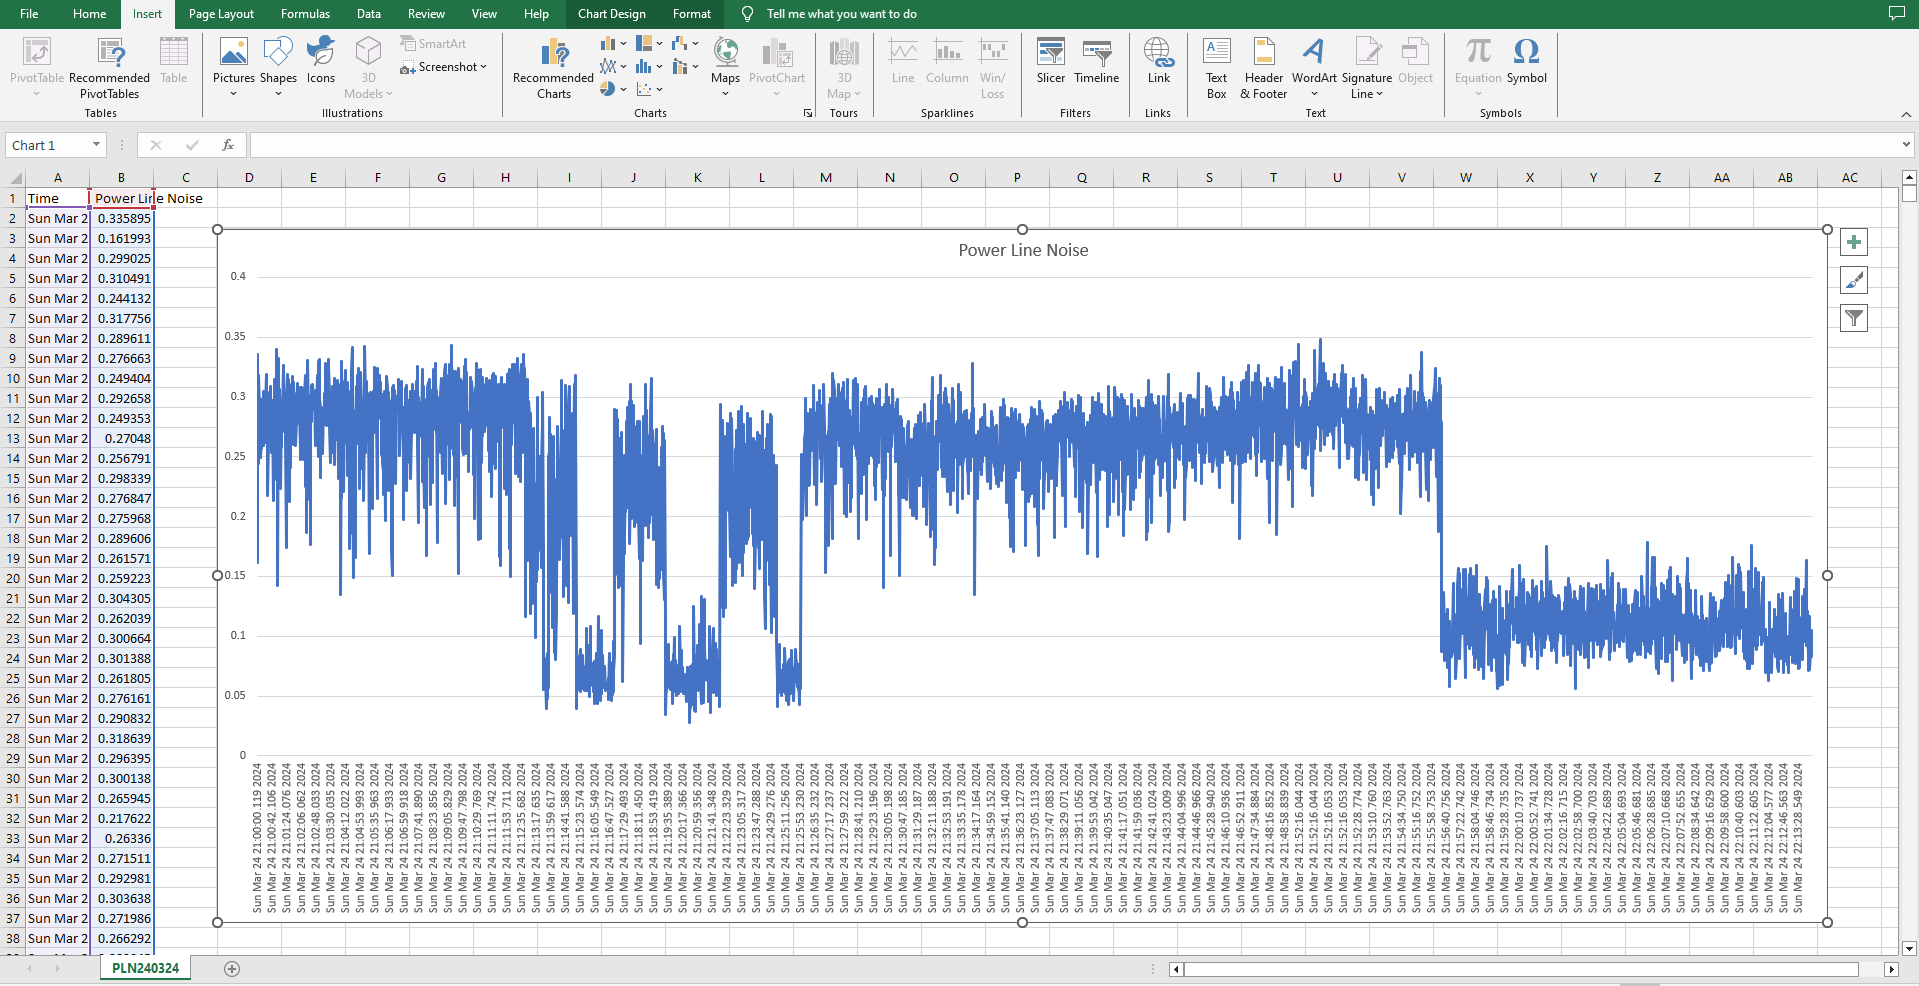
Tera Term can log the received text to a file and can add a timestamp. The time stamp is surrounded by squre brackets ([]). A large log file of the PLN data (using the command PLN [tab]n[cr] where n is the number of seconds) can edited to make it a CSV file. After the file is created, open the file in a text editor (such as Notepad ++). Replace the '[' characters with nothing. Replace the ']' characters with a comma. Add a line add a line at the top with comma delimited field names, such as "Time, Power Line Noise". Save the resulting file with the extension "csv".
The file can then be opened in a spreadsheet program such as Excel. Select the first two columns, then, under the insert tab, select Line Chart. Place the chart where you'data like. A sample screenshot is shown in the image to the right, while the XLS file is here. There are three drops in the noise level. These are during a QSO where the receiver was muted. Finally, the noise drops at 21:56:30 and remains low overnight. There were no changes in electrical load in our house at this time. Further, it seems unlikely that a power line insulator arc would suddenly stop. Most likely, a neighbor turned off some load this is putting noise on the power line.